We recently got a home weather station for tracking actual conditions in our home and garden. Living far from a public weather station, this has provided us with far more accurate data than we’ve ever had with standard reports. While interesting for weather nerds, it’s actually quite handy for gardening as well.
Have a look at how it works as well as a few unexpected features we did not anticipate.

Measuring the Weather Where You Live
Netatmo provided a Netatmo Weather Station for Smartphone and a rain gauge to test in our home and garden..
We spend hours a day in our living rooms, bedrooms and back yards, immersed in the air and environment in and around our houses. But other than the readings from a thermostat inside our house, we probably know very little about our home environment. And most of us have to rely on weather stations miles away—25 miles away, in our case—to know our outdoor temperatures.
The Netatmo Weather Station for Smartphone and its accessories look to fill that gap by giving you information about the environment in your house and yard. We’ve had the weather station and Netatmo Rain Gauge (sold separately) for a couple of weeks now, and have found it fun and informative in ways we wouldn’t have predicted.

Netatmo Weather Station | Amazon
What is a Weather Station
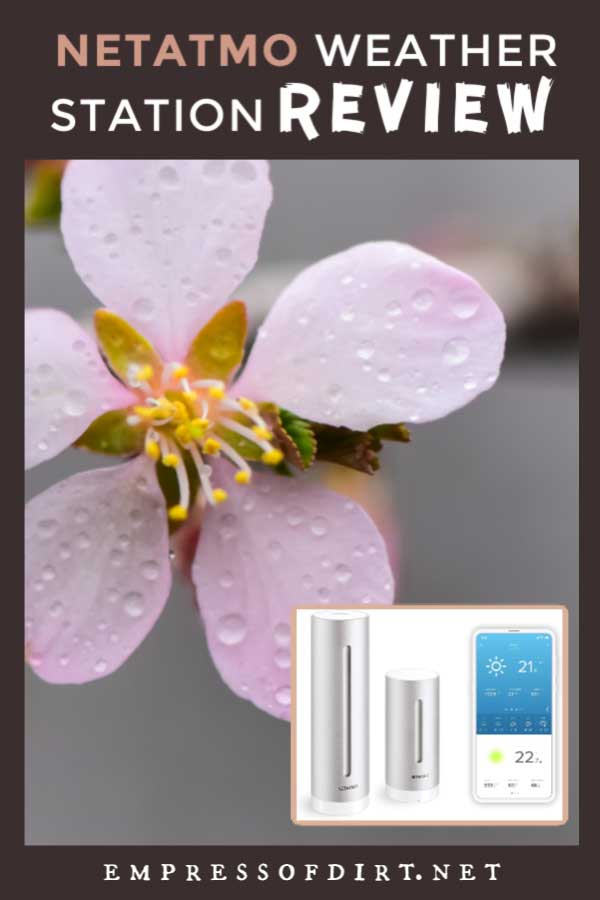
The Netatmo Weather Station for Smartphone consists of two aluminum cylinders—sleek and simple in appearance and probably not at all what you imagine a weather station looks like.
The taller unit can be placed anywhere inside your house near an electrical outlet—you’ll probably choose either the living room or your bedroom. The shorter one is battery-powered and is mounted outside the house. The company suggests placing it under the overhang of your roof.

Both units contain sensors that measure temperature and humidity (indoor and out). The indoor module also measures sound and carbon dioxide (CO2) levels. Note: that’s CO2 and not the far more dangerous CO—carbon monoxide—which would have been fantastic to have, but quickly takes you into critical life-or-death scenarios, so I can understand why it’s not included.

The outdoor module sends its data wirelessly to the indoor base which connects to the Internet through your home Wi-Fi network. Because it’s connected in to the Internet, you can read your data—both current and historical, and with all sorts of graphs—from anywhere, through both a web browser and a smartphone app. Installation instructions are also provided through the app.

You can also choose to contribute your outdoor readings to a global network of Netatmo weather stations. The indoor readings remain private, but you can give individual people—family members, for example—access to the data on your web dashboard if you’d like.

On the Netatmo web site there’s a map with thousands of stations from around the world—and yours will be there too, if that’s what you decide. This is where you can turn when you’re interested in current conditions farther afield than your back yard, or if you want to compare your readings to another station nearby.
How We’ve Used It
Over the first two weeks, the temperature in our back yard ranged from 16°C to -8°C (about 60°F to 18°F) with some wild swings between winter and spring weather. That means we saw it at work in furnace weather, but not under air conditioner conditions.
Here’s a look at the temperatures over a few days:

So far, we’ve found that we refer to it every day—and usually several times a day. Maybe the novelty will wear off, but maybe not—we’ve always looked at the temperature and forecasts on most days, and now we have better (or at least more personalized) data than ever before.
It turns out that that government-run weather station that we’ve had to rely on for all these years (also used by AccuWeather) shows temperatures very different from what we actually experience, with daily highs differing by up to 8°C (14°F).

The graphs show you at a glance patterns that you may never have thought about. For example, you can clearly see how well your furnace is working, as a graph shows you how the temperature jumps once the furnace is on (hopefully). I don’t know how long we thought it took for the furnace to warm the house, but now we see how much the temperature climbs in just half an hour. It’s much more informative than a thermostat reading. We’re not expecting that the air conditioner will bring the same results, but it will be interesting to see how it does.

Our CO2 readings barely got above zero for the first few days and it didn’t seem like that part of the station was going to be of much interest. And then the day came when we didn’t have the furnace on overnight. Without the air being blown through the house, we could see how quickly the CO2 built up overnight in the bedroom. So now we turn the furnace fan on overnight and that keeps the CO2 at zero the whole time. And the room does feel fresher when you wake up.
We also had some unanticipated uses for the station’s indoor decibel readings. Allegedly, one of us snores, and with the indoor unit in the bedroom, this can be seen—clearly and undeniably—in the morning when we look at the graphs. We also found the unit was sensitive enough to pick up music played in the basement or TV in the living room, and you can see why other people in the house sometimes get annoyed with the sounds.

The rain gauge has worked well and just the way you’d expect. It gives you hourly readings of your rainfall in millimeters (you will learn that 1.5 mm/h isn’t much and 6 mm/h is). Because it measures accumulation over an hour, you won’t get a reading off the charts if you have a brief torrential downpour.

The gauge doesn’t really work with snow, at least not in real time. When there’s a snowfall, the snow falls into the gauge and sits there and you can be in a snowstorm and the reading will be zero. Then, hours later, when there’s no rain or snow, you’ll get a reading as the snow in the gauge starts to melt. But it may give you some idea of how much water from the melting snow went into the ground.

We haven’t had the station long enough to say how long the batteries last in the outdoor components. Netatmo says it will likely be several months before they need replacing and from what we’ve seen, that looks to be the case. After two weeks of continuous use, the batteries in both the outdoor unit and the rain gauge still show at full strength. The current levels are shown on your web dashboard, so you won’t have to guess when they’re getting low. (UPDATE: We just replaced the batteries for the first time in the outdoor module. They lasted for nearly two and half years! UPDATE TO THE UPDATE: We’ve never been that lucky again! After several years the weather unit batteries do not last long—perhaps a month or two.)
The one annoyance we had was during installation—which is surprising (and preventable) since the process is actually very simple. For some steps, the instructions were just too sparse. You can tell from the look of the units how much Netatmo values design simplicity, but with the instructions they sometimes put simplicity over users’ needs for clear guidance. We figured it out, and you will too, but some details would have prevented the frustrations we had.
One thing to be aware of: immediately after you’ve installed the units, as you eagerly go to the app or website to see your first readings, there’s a good chance most of them will be way off. Handling the units—as you will during installation—distorts almost all of the readings and they don’t settle immediately. It took a couple of hours before we had accurate readings, but they’ve been fine ever since.
Want One?
Currently, the retail price for the Netatmo Weather Station for Smartphone as I’m writing this is CDN$180 (US$149) while the Rain Gauge for Netatmo Weather Station is CDN$110 (US$79). I don’t know if there’s some coldly rational cost-benefit analysis that would have convinced me that I needed the Netatmo Weather Station, but it’s been a lot of fun. And we’ve learned things we didn’t expect, even in a house where we’ve lived for years.
~Melissa the Empress of Dirt ♛
